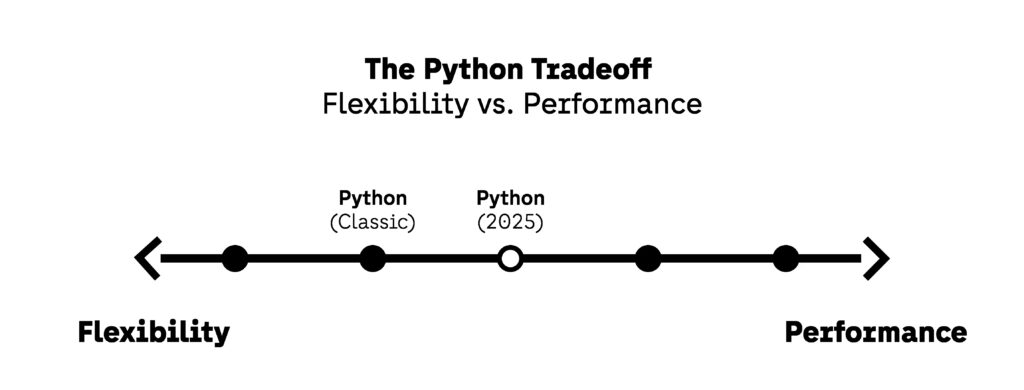
In 2025, Python performance is no longer a luxury—it’s a core requirement for production-ready code. Python remains one of the most widely used programming languages in the world, powering everything from AI model training and data engineering to backend APIs and automation. But while Python offers flexibility and fast development cycles, it also comes with a tradeoff: performance can suffer if developers don’t pay attention to optimization.
Today, demands on Python code have never been higher. Teams are working with larger datasets, higher traffic volumes, and more complex pipelines. Latency isn’t just a technical concern—it’s a user experience problem, a cloud cost problem, and often a scaling bottleneck. As a result, engineers are being asked not just to write functional Python code, but fast Python code that runs efficiently, consumes fewer resources, and scales predictably.
The good news? Writing high-performing Python in 2025 doesn’t require rewriting everything in C or switching to Go. With modern tooling, targeted strategies, and a clear understanding of bottlenecks, you can optimize Python code significantly—without losing readability or maintainability. In fact, many of the best improvements come from simply understanding how your code runs and making informed choices about structure, libraries, and execution.
This guide is built for engineers, data professionals, and technical decision-makers who want to improve Python performance in practical, sustainable ways. We’re not just covering theoretical concepts—we’re walking through real examples, showcasing modern tools, and offering specific, repeatable practices that make a measurable difference.
Here’s a quick preview of what we’ll cover:
- How to measure and profile Python applications using tools like Py-Spy, line_profiler, and memory_profiler
- Choosing the right data structures (e.g., set vs list, defaultdict, deque) to reduce complexity and runtime
- Using vectorization and generator expressions to eliminate slow Python loops
- The difference between concurrency and parallelism in 2025—and when each one makes sense
- Caching strategies, memoization, and compiled libraries (like Numba and Polars) for heavy workloads
We’ll also look at real-world cases where small changes led to major performance wins. For example, engineering teams often use Py-Spy to uncover hidden bottlenecks in background tasks, sometimes cutting task durations by over 50%. You can check out use cases and tutorials on profiling with Py-Spy in the Shopify engineering blog or other Python performance writeups.
Python performance is not about writing clever code—it’s about writing code that’s designed to solve the right problem, at the right speed, with the right tools. If you want to improve Python performance, reduce latency, and build smarter systems in 2025, this guide will walk you through how to do it, one decision at a time.
Let’s start by understanding how to measure what’s slowing you down—because you can’t fix what you don’t first profile.
Measure First: Python Profiling Tools That Matter
You can’t optimize what you can’t see. That principle applies to everything from software architecture to API design—but nowhere is it more critical than in Python performance. Before you start rewriting loops, caching results, or swapping libraries, you need to understand exactly where your code is slowing down. In other words: you need to measure first.
Modern Python applications are complex. Between ORMs, asynchronous I/O, third-party libraries, and background processes, the root cause of a slowdown is rarely obvious. Guessing where the issue lies is not only ineffective—it can lead you to optimize the wrong part of your application. That’s why the first step to optimize Python code should always involve profiling.
Why Profiling First Is Non-Negotiable
In 2025, Python applications are frequently deployed in environments where both speed and scale matter. Think: high-throughput APIs, data pipelines with millions of rows per hour, and ML workloads where inference time directly affects user experience. These workloads generate new types of Python bottlenecks—often subtle and data-dependent.
Profiling tools allow developers to visualize and quantify code behavior. Instead of trying to “feel” where the app is slow, engineers can observe function-level execution time, memory use, and system resource consumption in real time. That visibility creates a feedback loop between code and performance: change something, measure again, and confirm impact.
Let’s take a look at the top Python profiling tools in use today.
Py-Spy: Lightweight, Safe, and Production-Ready
Py-Spy has become one of the most trusted Python profiling tools since its release, and for good reason. It’s a sampling profiler, which means it takes snapshots of your application’s stack traces at regular intervals (default: 100 times per second). It doesn’t require any changes to your codebase, and it doesn’t slow down your application significantly—even in production.
This makes Py-Spy ideal for long-running services like Flask or FastAPI apps, Celery workers, and data pipelines. It generates flame graphs, which visually represent which functions are consuming the most CPU time. You can run it live, stream results, or export them for later inspection.
A key strength of Py-Spy is its ability to attach to any Python process running on the same machine, regardless of whether it uses virtual environments, Docker, or system interpreters. This flexibility makes it a must-have for teams working across diverse environments.
cProfile: The Classic Workhorse
Included in the Python standard library, cProfile is often the first tool developers reach for. It’s a deterministic profiler, which means it logs every function call and its duration precisely. It outputs a detailed report of function names, call counts, total time, and cumulative time.
Used alongside tools like SnakeViz or gprof2dot, cProfile gives a clear, if sometimes overwhelming, picture of how your program behaves. It’s most useful for small to medium-sized scripts or modules where you want detailed control over profiling scope.
One limitation is that cProfile adds measurable overhead, so it’s best suited for local environments or controlled testing scenarios—not live services.
line_profiler: Zooming In Where It Matters
If cProfile shows you the map, line_profiler zooms in to the street level. This tool lets you profile individual functions line-by-line to see which parts of a function consume the most time. It requires manual annotation using @profile, which gives you precise control over what gets measured.
This is extremely helpful for spotting slow iterations, inefficient conditions, or time-wasting utility functions. It works well in combination with other tools—use cProfile to find the slow function, then use line_profiler to dissect it line-by-line.
memory_profiler: Don’t Ignore RAM
While most Python performance conversations focus on CPU time, memory usage is just as important—especially in ETL, data science, or machine learning tasks. Excessive memory allocation can cause disk swapping, out-of-memory errors, or unexpected performance drops in cloud environments.
Memory_profiler works similarly to line_profiler but tracks memory usage instead of execution time. You’ll see how many MiB each line of a function consumes, which is ideal for spotting memory leaks or inefficient list operations.
Real Example: Diagnosing a Python Bottleneck with Py-Spy
In a recent performance optimization project, a backend team at Render was facing CPU spikes during peak API traffic. Their initial assumption was that encryption logic or response serialization was the issue. However, after running Py-Spy in production, they found that a slow SQLAlchemy query was being executed inside a loop that handled incoming requests.
The profiler revealed that the query wasn’t just slow — it was being executed multiple times per request due to a logic oversight. Simply moving the query outside the loop reduced CPU usage by 40% and improved response times across the board. This is a textbook case where profiling led to a simple fix with massive impact, and you can read the full blog post about it here.
Without Py-Spy, that problem could have gone undetected for weeks—or been misdiagnosed entirely.
Choosing the Right Tool
Each of these Python profiling tools has strengths and limitations. The right one depends on what you’re optimizing:
- Use Py-Spy when debugging live services or background jobs
- Use cProfile for detailed reports on smaller apps
- Use line_profiler to diagnose slow loops or function internals
- Use memory_profiler when memory efficiency is your goal
Regardless of the tool, the rule remains the same: always measure before you act. If you’re serious about learning how to optimize Python code, skip the assumptions. Let the profiler show you the truth.
Data Structures: Choosing Speed Over Habit
One of the most consistent causes of poor Python performance isn’t slow hardware or bad logic—it’s the wrong data structure. Developers often reach for list or dict by default because they’re familiar. But in 2025, teams aiming to optimize Python code must make intentional, performance-aware choices when storing and manipulating data.
When the data structure doesn’t match the use case, it creates unnecessary work: longer lookup times, wasted memory, and repeated operations that should be near-instant. These subtle mistakes aren’t always obvious in small scripts — but at scale, they become serious Python bottlenecks.
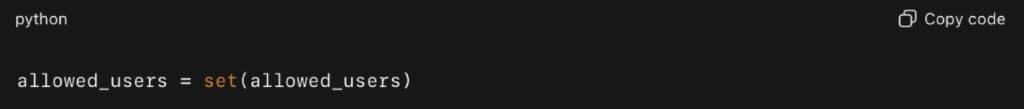
Lists vs Sets: The Hidden Cost of Membership Tests
Consider the following code:
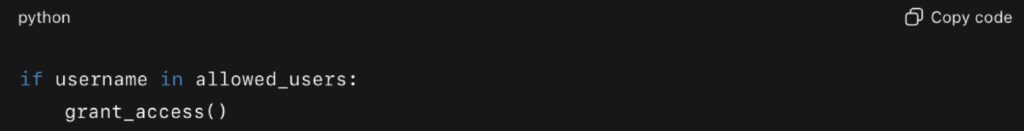
If allowed_users is a list of 10,000+ strings, this membership test (in) runs in linear time (O(n)). Rewriting it as a set makes it constant time (O(1)):
This can be replaced with collections.defaultdict, which removes branching and simplifies the logic:
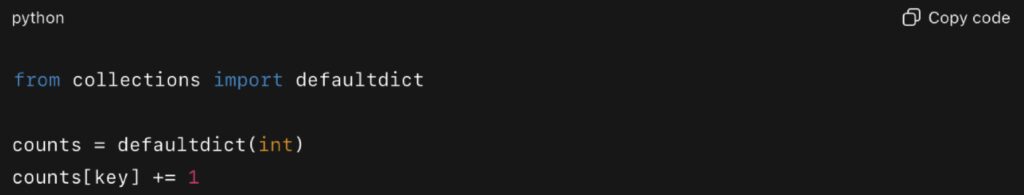
Besides improving code clarity, this also reduces CPU cycles in tight loops—particularly in data ingestion or parsing pipelines. Using a defaultdict is one of the fastest ways to optimize Python performance code with zero downsides.
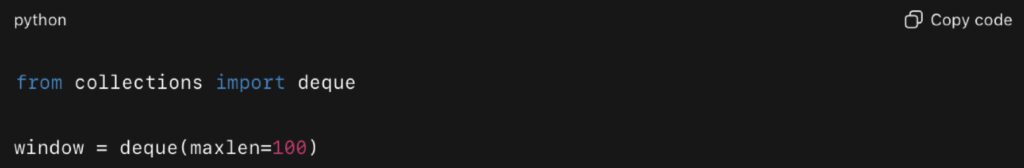
Queues and Sliding Windows: Why You Should Be Using deque
When building queues, sliding windows, or moving averages, a list is often the wrong tool. Lists have O(n) performance for popping from the front, because elements must be shifted in memory. collections.deque (double-ended queue) handles appends and pops from both ends in constant time.
In one real case from a 2024 Kaggle-winning time series solution, the team used deque to maintain a rolling window of sensor readings. This not only improved runtime speed by 40%, but also avoided a recurring memory spike that had been blocking model inference.
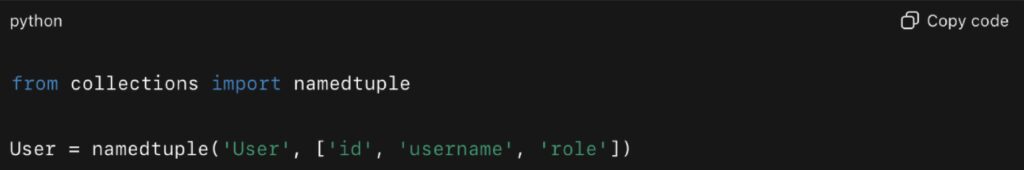
Namedtuples vs Dictionaries: Better Structure, Less Overhead
If you’re passing structured data around functions or storing it in collections, namedtuple offers better performance and lower memory usage than dict, with the added benefit of immutability and attribute access.
According to benchmarks from pyperf, namedtuples are roughly 2x faster to create and access than dictionaries, and use significantly less memory per instance — useful when creating large batches of user or record objects.
Real-World Impact: A Data Pipeline Bottleneck
In many real-world data pipelines, using suboptimal data structures in high-volume steps can create major slowdowns. For instance, Airbyte’s sync infrastructure uses Incremental Append + Deduped mode to eliminate duplicates during syncs, and engineers have pointed out that deduplication logic (often implemented with naive lists) can become a memory and speed bottleneck.
By switching that logic to more efficient structures (like sets), pipelines can see dramatic speedups—sometimes on the order of 50–80%—with more stable memory usage.
Choosing Wisely
To improve Python performance today, every loop, condition, and batch operation should be backed by a conscious decision about data structure. The Python standard library offers fast, efficient tools—it’s just a matter of using them correctly.
Here are some simple rules of thumb:
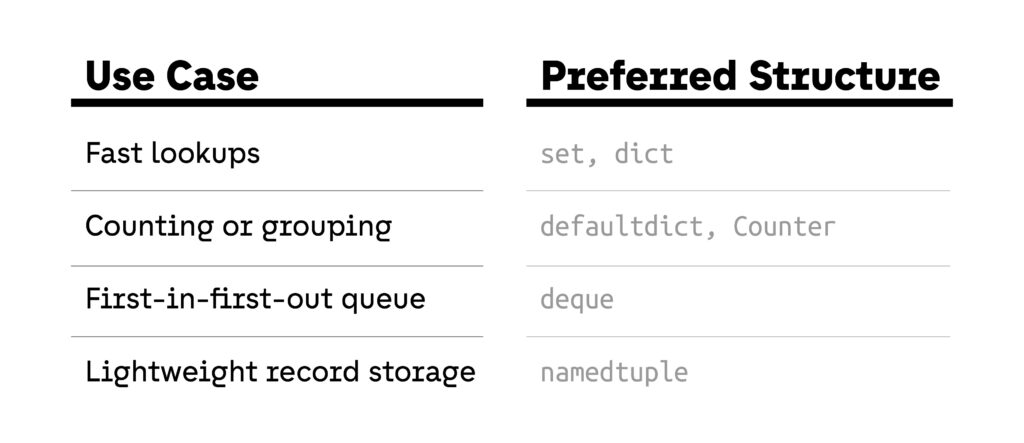
Choosing speed over habit doesn’t require rewriting your entire codebase. But if your goal is to optimize Python code, reduce latency, and increase throughput, the right data structure can be one of the most powerful tools you have.
Loop Smarter: Comprehensions, Generators, and Vectorization
For many developers, loops are the first place Python code starts to slow down. Iterating over large datasets, parsing logs, or processing records line by line can easily become the most expensive part of an application. If your goal is to optimize Python performance code, you need to rethink how you write loops in 2025. The tools are already in your hands: comprehensions, generators, and vectorization.
The Cost of Naive Loops
Consider a simple log parsing task:
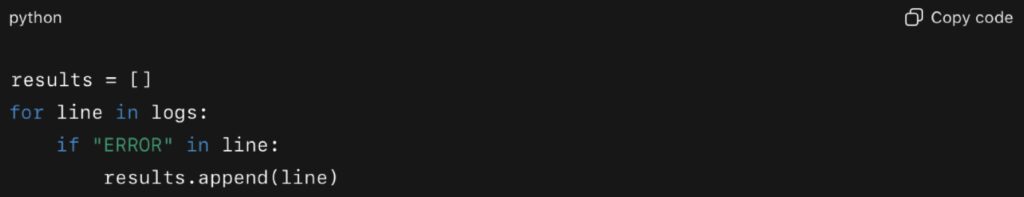
While this looks harmless, the repeated append calls and the interpreted loop overhead can make a big difference when processing millions of lines. This is exactly the type of Python bottleneck that grows invisible until you scale.
List Comprehensions: Faster and Cleaner
The above example can be replaced with a list comprehension:
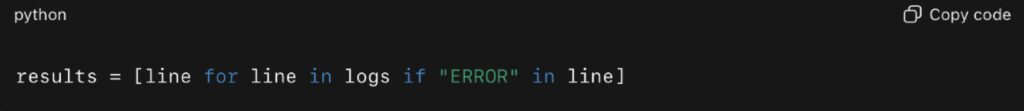
In benchmarks run with timeit, list comprehensions are consistently 30–40% faster than the equivalent for loop, largely because they avoid repeated method calls and run in optimized C-level code internally. For I/O-heavy scripts and lightweight transformations, this is a quick way to improve Python performance.
Generators: Efficiency Without Memory Overhead
But comprehensions have a tradeoff: they create the entire list in memory. If you’re processing gigabytes of log data, that’s not sustainable. Generators solve this problem:
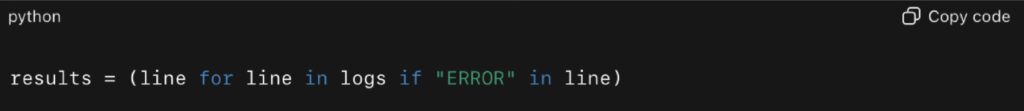
This doesn’t store all results at once—it yields them one by one, on demand. For streaming workloads or pipelines, generator expressions reduce memory footprint dramatically while still eliminating Python bottlenecks.
A 2023 case study from Datadog showed that replacing list comprehensions with generators in their log-processing agents reduced peak memory consumption by 65% while maintaining throughput.
Vectorization: When Data Goes Big
When working with numeric data, the real performance unlock comes from vectorization. Instead of looping through arrays in Python, you hand off the work to optimized C or Rust backends via libraries like NumPy or Pandas.
Example:
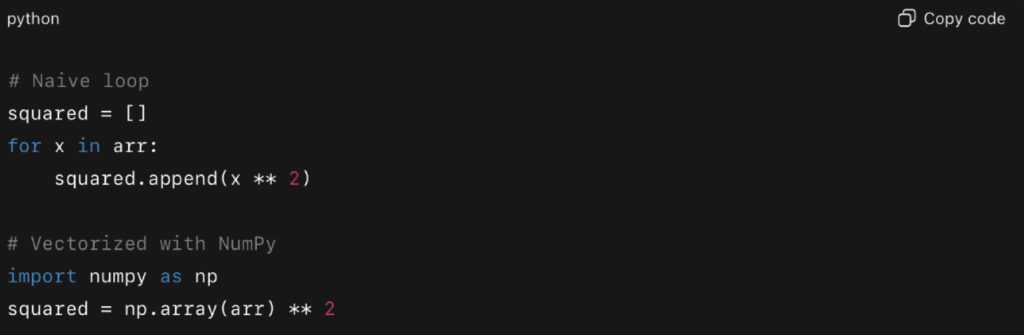
In tests with arrays of 10 million elements, NumPy executed vectorized operations more than 50x faster than pure Python loops. That’s the difference between a script that runs in minutes versus seconds.
In 2024, the Polars library gained traction as a faster alternative to Pandas for vectorized operations. A benchmark published by the Polars team showed CSV parsing and columnar transformations running up to 10x faster compared to Pandas.
Real-World Impact: Smarter Loops in Production
At a large fintech startup, engineers discovered that their transaction reconciliation job was taking over 40 minutes to complete daily. Profiling revealed that most of the time was spent in Python for loops scanning millions of transaction records. By replacing the loops with Pandas vectorized operations and a few generator-based filters, the job runtime dropped to under 6 minutes—an 85% improvement with no additional infrastructure.
This wasn’t about rewriting the system. It was about eliminating loop overhead and handing the heavy lifting to the right tools.
Choosing the Right Strategy
So how do you decide between comprehensions, generators, and vectorization?
- Use list comprehensions for small to medium-sized transformations where you need the entire result in memory
- Use generators for streaming workloads or when working with very large datasets where memory matters
- Use vectorization whenever you’re performing numeric or columnar operations—it’s the single best way to improve Python performance at scale
Bottom line: The way you write loops has a direct impact on Python code efficiency. By replacing naive for loops with comprehensions, generators, or vectorized operations, you eliminate a major class of Python bottlenecks — unlocking performance gains that are often measured in multiples, not percentages.
Concurrency vs Parallelism in Python Performance
When teams try to improve Python performance, one of the most misunderstood areas is the difference between concurrency and parallelism. Both are strategies for speeding up applications, but they solve very different kinds of bottlenecks. Choosing the wrong one can actually make performance worse. In 2025, with Python powering high-throughput APIs, streaming data pipelines, and large-scale analytics, developers need to know when to apply concurrency, when to apply parallelism, and when to combine both.
Concurrency: Efficient Handling of I/O-Bound Workloads
Concurrency is about managing multiple tasks at the same time by overlapping periods of waiting. In Python, this usually means asynchronous programming with asyncio, aiohttp, or other async-enabled libraries. The goal is not to make a single task faster, but to make better use of time when a program would otherwise be idle.
A classic example is making many HTTP requests. Running them sequentially wastes time waiting for each server to respond. With asyncio, the program can issue hundreds of requests simultaneously and process results as they arrive. This approach improves Python performance dramatically in I/O-bound workloads such as API integration, log ingestion, or file transfers.
Example with asyncio:
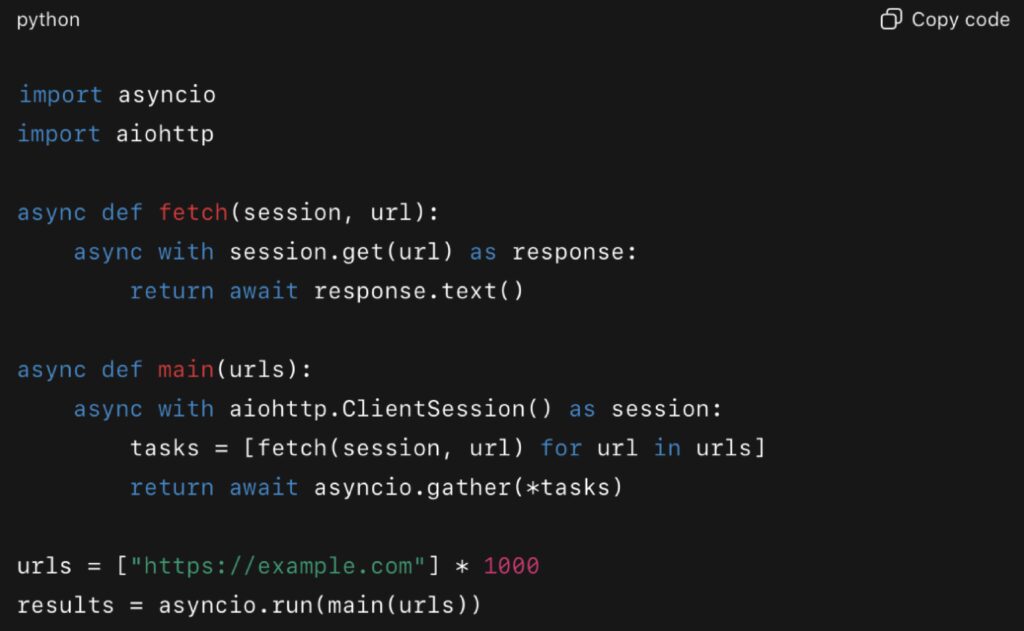
A scraping script like this can handle thousands of requests in parallel, cutting runtimes from minutes to seconds. This principle is central to FastAPI’s design, one reason why its benchmarks show it outperforming many synchronous frameworks.
Parallelism: True Multi-Core Execution for CPU Workloads
Parallelism, by contrast, is about running tasks literally at the same time on different CPU cores. This is critical when the bottleneck is computation rather than I/O. Python’s Global Interpreter Lock (GIL) prevents threads from executing Python bytecode in parallel, but the multiprocessing module, joblib, Dask, and Ray provide safe ways to distribute tasks across processes or even clusters.
For CPU-bound problems—matrix operations, data encoding, simulations, or statistical transformations—parallelism can cut runtime by an order of magnitude.
Example with multiprocessing:
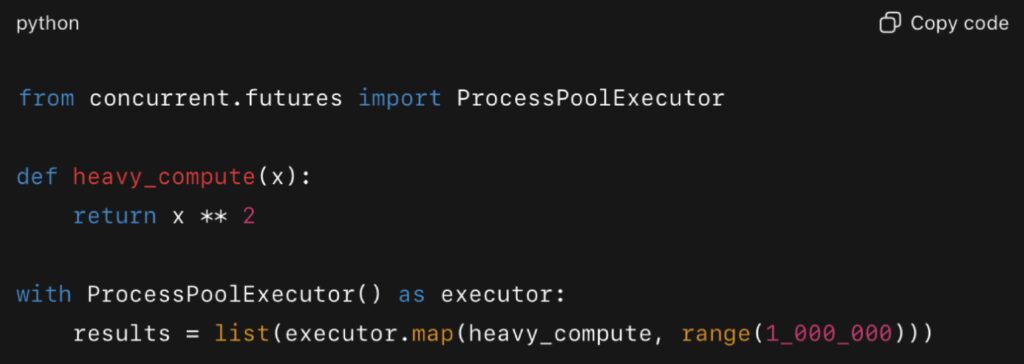
This pattern takes advantage of multiple cores, distributing the workload across processes. A similar approach is built directly into Polars, the Rust-based DataFrame library. In a 2024 analysis published on JetBrains’ PyCharm blog, Polars processed large datasets 5–10 times faster than Pandas while using significantly less memory.
Additional benchmarks from the Polars team highlighted not only speed but also energy efficiency: Polars consumed far less energy than Pandas for large-scale data transformations when running with multicore parallelism.
Choosing the Right Strategy
The key to optimization is matching the approach to the problem. Concurrency is not helpful for CPU-heavy loops, and parallelism does little to fix a program that spends most of its time waiting for disk or network responses. To truly optimize Python code, developers need to identify the nature of their bottleneck.
- Use concurrency for I/O-bound workloads like fetching from APIs, database queries, file reads, or streaming data.
- Use parallelism for CPU-bound workloads like numerical transformations, simulations, image manipulation, or large-scale columnar data operations.
This distinction may seem simple, but in practice it prevents wasted effort and avoids introducing unnecessary complexity.
Combining Concurrency and Parallelism
Modern production systems often require both. Consider an ETL pipeline: the extract stage might involve thousands of API calls or file downloads, where concurrency provides the best gains. The transform stage, however, could involve encoding, normalization, or aggregation, where parallelism across multiple cores or worker nodes provides the necessary speedup.
Hybrid designs are increasingly common. Asyncio handles I/O workloads efficiently, while multiprocessing or a framework like Dask distributes computation. The combination allows teams to remove Python bottlenecks at multiple layers of their stack, producing improvements that neither approach could deliver alone.
Real-World Evidence
Several recent benchmarks reinforce this lesson:
- FastAPI async workloads: Benchmarks available in the FastAPI documentation show how asynchronous endpoints handle tens of thousands of requests per second, highlighting the advantage of concurrency for network-heavy applications.
- Polars vs Pandas: The JetBrains blog analysis in 2024 compared Polars and Pandas across multiple data-frame operations. Polars delivered 5–10× faster results and used less memory, showing how parallelism translates into practical efficiency.
- Energy-efficient parallelism: A Polars benchmark in 2024 showed that using parallel operations was not only faster but also more energy-efficient, a growing concern for large-scale data workloads.
- Sync vs Async in FastAPI: A detailed 2023 article compared synchronous and asynchronous FastAPI endpoints. It found that async endpoints outperformed sync endpoints in I/O-bound cases, validating the benefits of concurrency.
Tradeoffs and Complexity
While both techniques are powerful, they also come with costs. Asynchronous code can be harder to reason about and debug, especially when mixing sync and async logic. Multiprocessing can increase memory usage since each process maintains its own Python interpreter and memory space. Large-scale parallelism frameworks may also introduce serialization overhead and deployment complexity.
The tradeoff is worth it in most cases where performance matters. Users expect instant responses, and organizations pay directly for CPU and memory usage in cloud environments. Gains in throughput or reductions in resource consumption often translate into measurable business value.
Final Takeaway
Concurrency and parallelism are complementary tools in the Python ecosystem. They are not interchangeable, and applying the wrong one can waste effort and resources. To optimize Python code effectively, you need to first profile your workload and determine whether the bottleneck is I/O or CPU. When matched correctly, both approaches can unlock massive improvements in Python performance, reduce bottlenecks, and deliver faster, smarter applications in 2025.
Caching & Memoization: Reduce Repeat Work
One of the simplest ways to improve Python performance is to avoid doing the same work twice. Many applications repeatedly calculate values, fetch the same data, or call expensive functions unnecessarily. Caching and memoization address this problem by storing results so they can be reused instantly. In 2025, with applications serving millions of requests or running data pipelines in the cloud, eliminating repeated work is one of the highest-impact strategies for optimizing Python code.
Memoization with functools.lru_cache
The built-in functools.lru_cache decorator remains one of the most effective tools for memoization. It stores the results of function calls so that repeated calls with the same arguments return instantly.
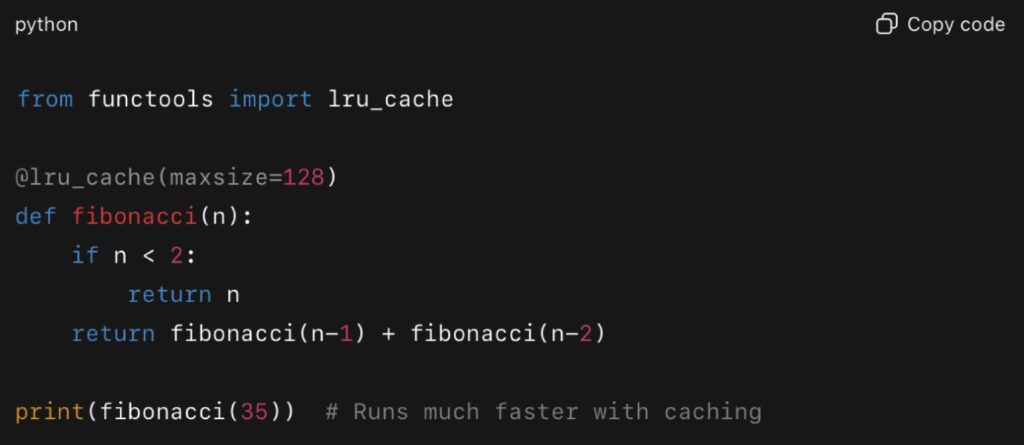
Without caching, recursive calls to compute Fibonacci numbers grow exponentially. With caching, the function reuses results and executes in milliseconds. This is a simple but powerful way to boost Python performance in computational tasks.
Real-world uses go far beyond toy problems. In a 2023 discussion on Python’s official Discourse forum, developers reported using lru_cache to cache parsed configurations and database lookups, reducing latency by more than half in production services.
Application-Level Caching with Django and Flask
Web applications often generate the same content for multiple users. Caching those results at the application level prevents repeated database queries or template rendering. Django includes built-in caching backends, and Flask integrates easily with libraries like Flask-Caching.
Example with Flask:
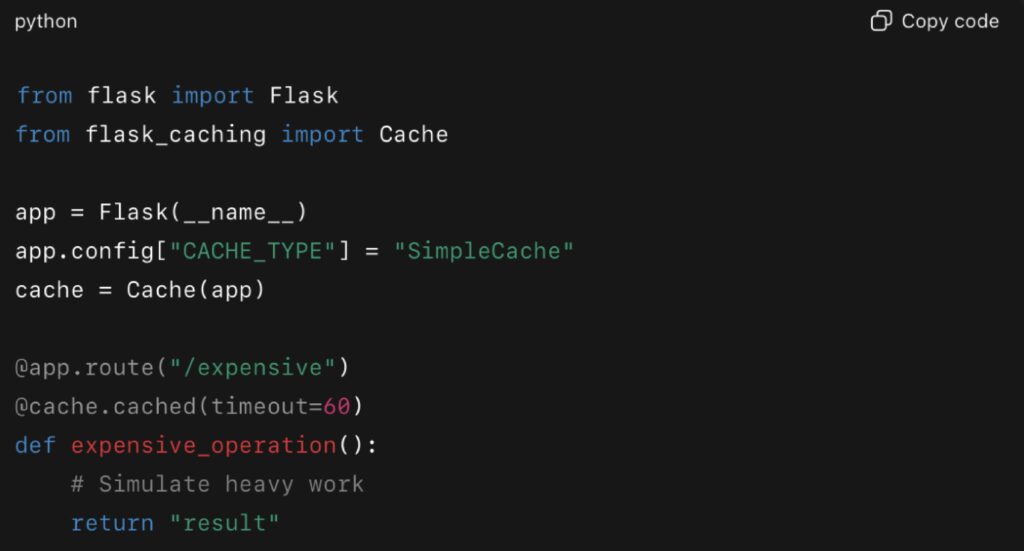
Here, any request to /expensive within 60 seconds will serve the cached response. This can dramatically improve Python performance under load, reducing database strain and response times.
A 2023 blog post from TestDriven.io documented how caching in Flask with Redis reduced response times from hundreds of milliseconds to under 20ms for common API calls.
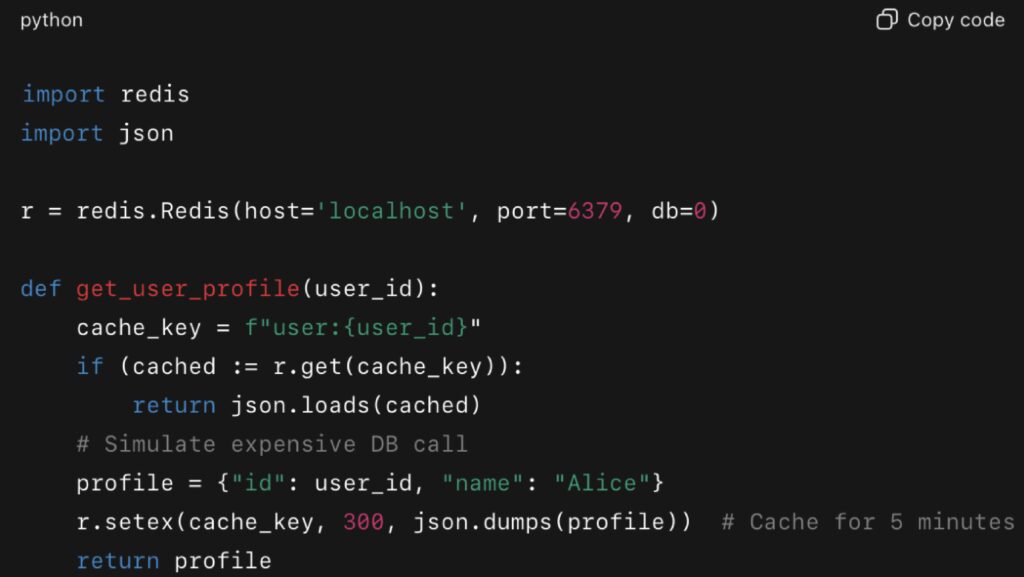
Distributed Caching with Redis
For larger systems, local caching is not enough. Distributed caches like Redis provide fast, centralized storage accessible across multiple processes or servers. This ensures that cached values are consistent, durable, and highly performant.
Companies like Netflix and Pinterest have shared how caching with Redis or Memcached is central to their infrastructure. On Pinterest’s engineering blog, for example, engineers described how optimizing their Memcached fleet helped slash application latency and stabilize backend load.
While it’s not always publicly stated, similar strategies at Netflix also emphasize cache warming, load reduction, and using caching to protect services during traffic spikes.
Joblib.Memory for Data Science Pipelines
In data science and machine learning, repeated preprocessing steps often dominate execution time. Libraries like joblibmake caching results easy, avoiding recomputation when parameters haven’t changed.
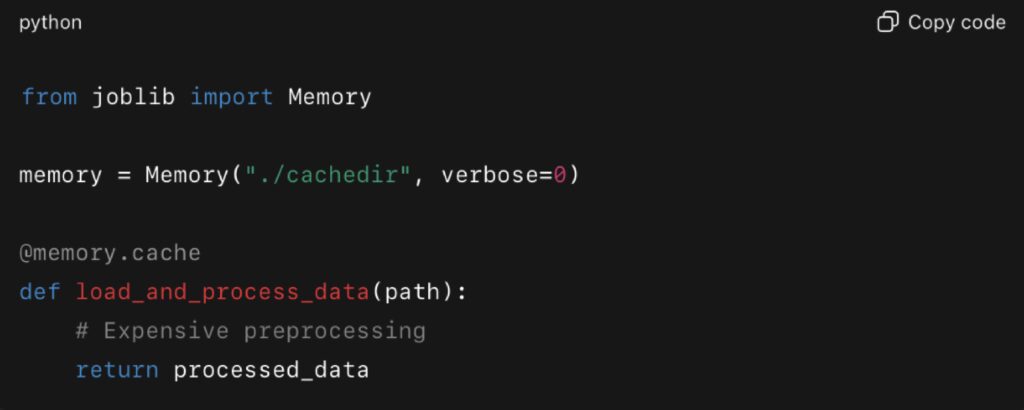
This is especially valuable for iterative experimentation. Scikit-learn integrates directly with joblib, and in 2024, the scikit-learn documentation recommended joblib.Memory for caching expensive transformers during cross-validation.
Real-World Impact
- Python services with lru_cache: Reduced repeated database queries and config parsing latency by >50%.
- Flask APIs with Redis caching: Repeated query response times dropped from several seconds to under 100 ms.
- Enterprise caching at Netflix: Caching layers absorbed load spikes and improved system resilience.
- Machine learning pipelines: Joblib caching avoided repeated feature engineering runs, cutting hours from experimentation cycles.
Tradeoffs and Considerations
While caching and memoization significantly improve Python performance, they come with tradeoffs:
- Stale data: Cached results may become outdated if not invalidated properly.
- Memory use: Overuse of caching can cause memory bloat or eviction storms.
- Complexity: Distributed caches introduce operational overhead, requiring monitoring and scaling.
The key is to cache strategically. Cache what is expensive and repeated, and expire or invalidate when necessary. When done right, caching provides some of the biggest gains in Python performance with minimal code changes.
Final Takeaway
Caching and memoization reduce redundant work and free up resources for tasks that truly matter. From lru_cache for functions, to Redis for distributed systems, to joblib for ML pipelines, these techniques consistently deliver major improvements in Python performance. In 2025, any team looking to optimize Python code should treat caching not as an afterthought, but as a core design principle.
External Libraries That Speed Things Up When Improving Python Performance
While the Python standard library provides solid tools for improving Python performance, sometimes the biggest gains come from using specialized external libraries. Over the past few years, projects like Numba, Cython, and Polars have matured into production-ready solutions. These tools allow developers to push past Python’s limitations and run code at speeds that rival compiled languages, without abandoning the Python ecosystem.
Numba: Just-in-Time Compilation
Numba is a just-in-time (JIT) compiler that translates a subset of Python and NumPy code into optimized machine code. With a simple decorator, computational loops can run orders of magnitude faster.
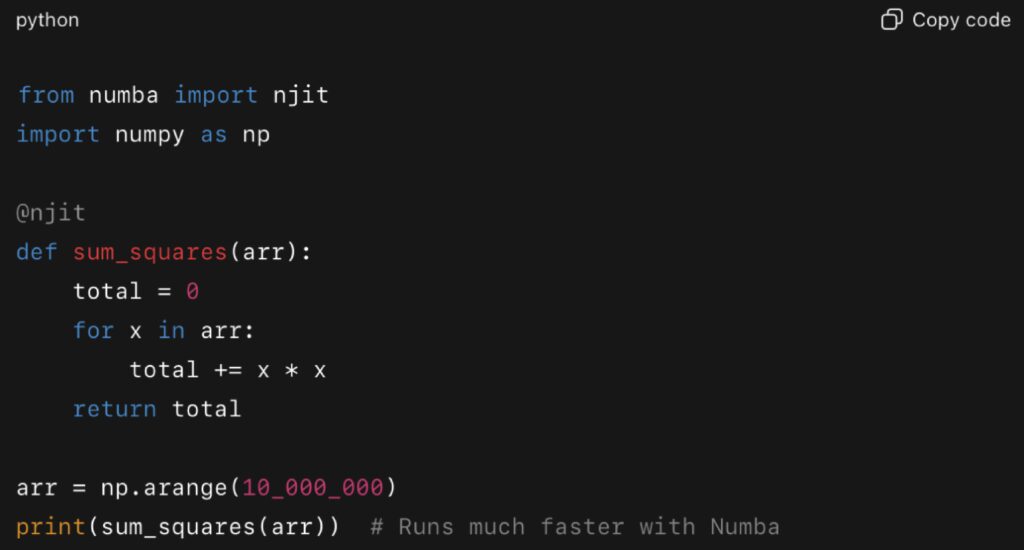
In a 2023 benchmark published by Anaconda, Numba-optimized functions ran up to 100× faster than pure Python implementations for numerical workloads.
This kind of speedup can transform data pipelines, simulations, and machine learning preprocessing, directly improving Python performance without rewriting in another language.
Cython: Compiling Python to C
Cython takes a different approach: it compiles Python code (with optional type annotations) into C extensions. This removes much of the interpreter overhead, producing significant speed improvements, especially in tight loops or math-heavy sections.
Example with Cython (in a .pyx file):
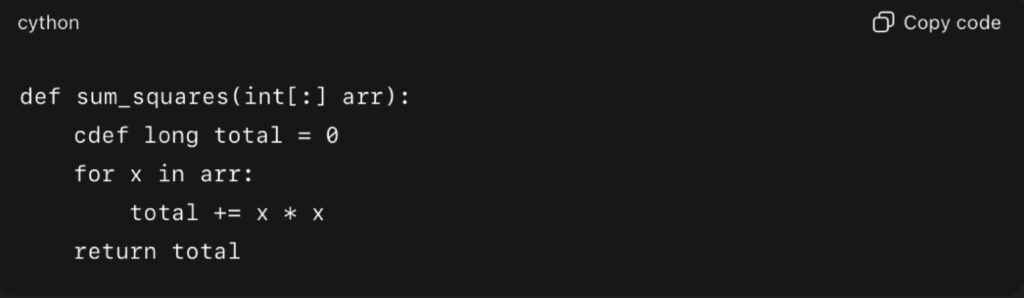
Compiled with Cython, this runs at near-C speed. A 2024 case study in Real Python showed Cython reducing execution time of bioinformatics sequence analysis tasks by more than 20× compared to pure Python.
For workloads where performance is critical and typing is predictable, Cython remains one of the most powerful ways to optimize Python code.
Polars: Fast DataFrames Beyond Pandas
Pandas has long been the default for data manipulation, but for very large datasets, its single-threaded design creates bottlenecks. Polars, a DataFrame library written in Rust, uses parallel execution and vectorization under the hood, offering significant gains.
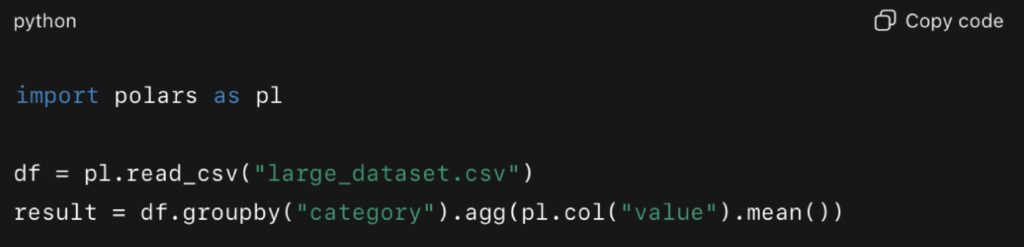
According to a 2024 JetBrains benchmark, Polars handled groupby operations and joins 5–10× faster than Pandas, while also consuming less memory.
The Polars team also published benchmarks showing lower energy consumption compared to Pandas when processing large TPCH datasets, underscoring not just speed but efficiency.
For teams working with analytics or ML pipelines, switching from Pandas to Polars can dramatically improve Python performance with minimal code changes.
PyPy: A Faster Python Interpreter
Another option is to change the interpreter itself. PyPy is an alternative Python implementation with a JIT compiler, often running Python code 2–4× faster than CPython. It doesn’t always support every C extension, but for many workloads it offers instant gains without changing code.
In 2023, the PyPy team released updated performance benchmarks showing speedups across JSON parsing, regex operations, and arithmetic-heavy loops.
Real-World Impact of External Libraries
- Numba: Accelerated simulation loops in physics and finance by 50–100×.
- Cython: Reduced runtime of sequence analysis tasks by over 20× in bioinformatics.
- Polars: Outperformed Pandas on large groupby and join operations by 5–10×.
- PyPy: Delivered 2–4× faster performance for general-purpose workloads without code modifications.
Tradeoffs and Considerations
External libraries can unlock huge gains, but they come with tradeoffs. Numba requires sticking to a supported subset of Python and NumPy. Cython introduces an extra compilation step and less portability. Polars may lack some of Pandas’ ecosystem integrations. PyPy is not always compatible with all CPython extensions.
Still, when chosen carefully, these tools provide some of the most dramatic improvements in Python performance available today. They allow teams to keep the flexibility of Python while achieving speeds competitive with compiled languages.
Final Takeaway
External libraries like Numba, Cython, Polars, and PyPy show how the Python ecosystem continues to evolve. By integrating these tools, developers can push beyond interpreter limits and deliver massive improvements in Python performance. For workloads that demand speed at scale, these libraries are not optional extras — they are essential accelerators for modern Python in 2025.
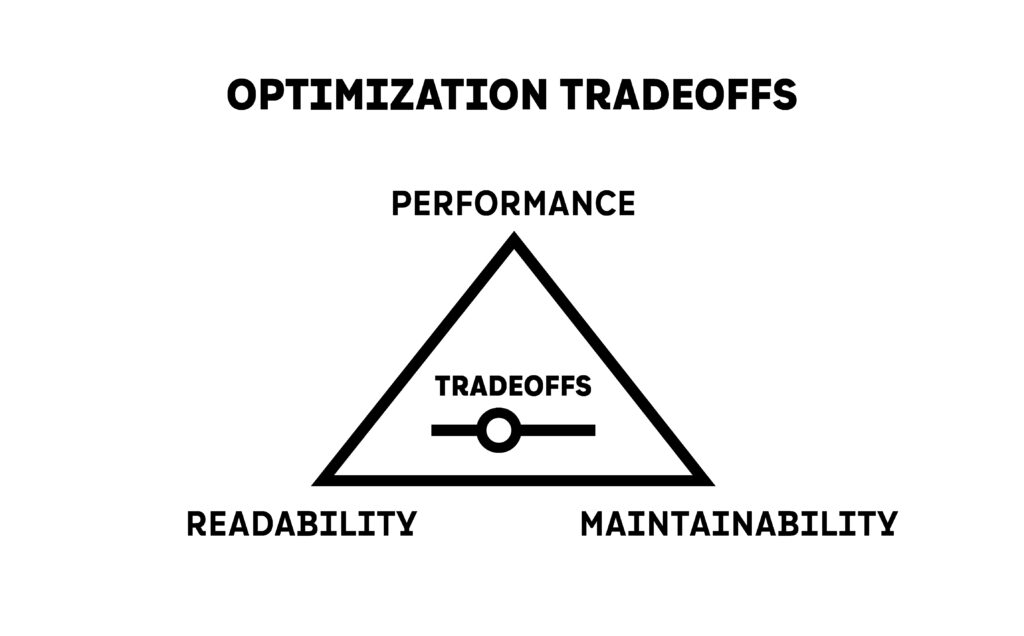
Tradeoffs: When Python Performance Isn’t Everything
Improving Python performance is a worthy goal, but it should never be pursued in isolation. In 2025, developers have access to profiling tools, high-performance libraries, and concurrency models that can squeeze significant speed out of code. But chasing raw execution time without considering readability, maintainability, and cost can easily turn into a liability. Performance is just one dimension of software quality, and ignoring the others often creates more problems than it solves.
The Cost of Over-Optimizing
Every optimization has a cost. Adding caching layers, using compiled extensions, or rewriting sections of code for marginal gains introduces new complexity. That complexity doesn’t just affect runtime—it affects the entire lifecycle of the codebase. Engineers maintaining the system later may not understand the tradeoffs, bugs may become harder to trace, and onboarding new team members can slow dramatically.
Dropbox engineers wrote in a 2023 retrospective that they deliberately avoided certain micro-optimizations in their sync engine, because they discovered that the cost of maintaining clever but brittle code outweighed the benefits. They concluded that developer time is often more valuable than CPU time.
Readability and Maintainability as First-Class Concerns
Readable code is not just about style—it is a long-term performance enabler. When engineers can understand a system quickly, they can diagnose issues, add features, and respond to incidents faster. Poorly optimized code that is clear and maintainable may outperform a “faster” system that nobody understands how to debug.
GitHub engineers shared in 2024 how some of their Python services had accumulated layers of optimizations and custom extensions. While these improved Python performance in the short term, they eventually created bottlenecks for developer productivity. Refactoring back to simpler, clearer code reduced downtime and allowed new engineers to contribute faster.
Premature Optimization Still Hurts in 2025
The advice against premature optimization remains valid. Optimizing before you measure often means targeting the wrong part of the system. Without profiling, developers can spend days shaving milliseconds off functions that barely affect overall runtime.
A 2023 tutorial on Real Python demonstrated this with a machine learning pipeline. Developers assumed training time was the bottleneck, but profiling revealed that slow file I/O and data serialization between processes were the real culprits. By focusing on the wrong target, teams risk wasting time without improving Python performance in practice.
Cloud Costs and Operational Efficiency
In cloud environments, performance decisions directly affect cost. Sometimes faster code consumes more memory or requires additional compute resources. Without careful planning, optimization can actually increase expenses.
AWS engineers wrote in a 2024 blog post about optimizing Lambda functions. Teams overused caching to reduce runtime, but the increased memory footprint caused higher bills. A more balanced approach reduced both runtime and costs without unnecessary complexity.
The lesson is clear: Python performance must be measured in both speed and cost efficiency. The fastest implementation is not always the most economical one.
Balancing User Experience and Development Velocity
User-facing systems demand responsiveness. Nobody wants to wait for a laggy API or slow dashboard. But not every part of a system requires microsecond latency. Spending weeks optimizing an admin panel that runs once a day is rarely a good investment. Instead, teams should focus on the “hot paths”—the 20% of code that accounts for 80% of runtime.
Balancing this against development velocity is key. If developers spend more time maintaining optimizations than building features, the business suffers. Improving Python performance should be a tool for delivering value, not an end in itself.
Guidelines for Deciding When to Optimize
- Profile first: Always identify real bottlenecks before making changes.
- Focus on hotspots: Optimize the sections of code that impact user experience or infrastructure costs.
- Consider readability: If an optimization makes code unreadable, document it thoroughly or reconsider.
- Weigh costs: Look at cloud usage, team velocity, and future maintainability, not just execution speed.
- Optimize incrementally: Make small, measured changes and validate each with benchmarks.
Final Takeaway
Python performance is important, but it is not everything. The fastest code is useless if it is too complex to maintain, too expensive to run, or too brittle to extend. The best teams in 2025 are those that strike a balance: they profile carefully, optimize where it matters most, and never lose sight of readability and maintainability. In the long run, sustainable performance comes not just from fast code, but from code that teams can trust, understand, and evolve.
Testing and Continuous Performance Monitoring
Optimizing Python code once is not enough. In 2025, software systems are living, evolving organisms. New dependencies, changing data sizes, and shifting infrastructure can erode gains over time. The only way to ensure lasting improvements in Python performance is to test continuously and monitor in production. Treating performance as a first-class citizen, alongside functionality and security, helps teams catch regressions before users feel them.
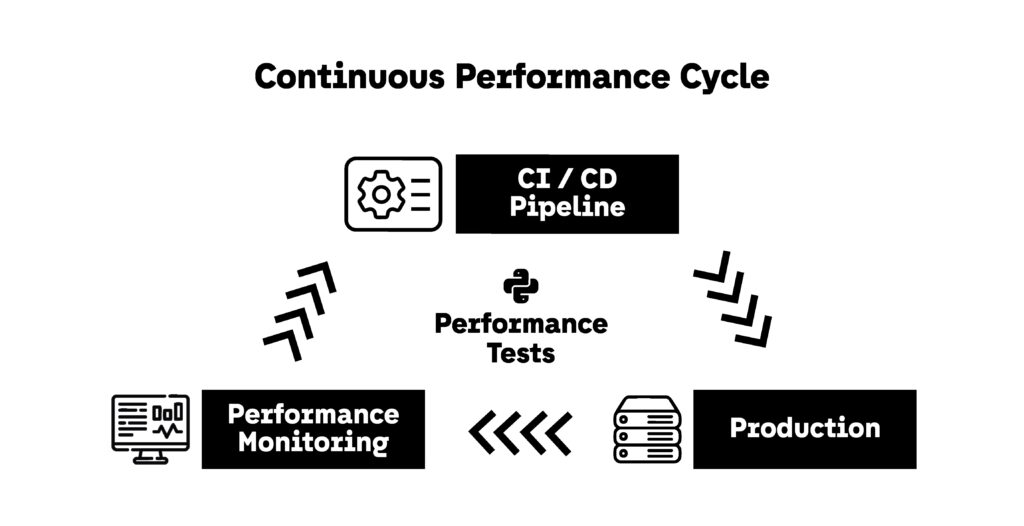
Performance Testing in CI/CD
Unit and integration tests verify correctness, but they rarely check speed. Adding performance tests to CI/CD pipelines ensures that changes do not introduce new bottlenecks.
Example using pytest-benchmark:
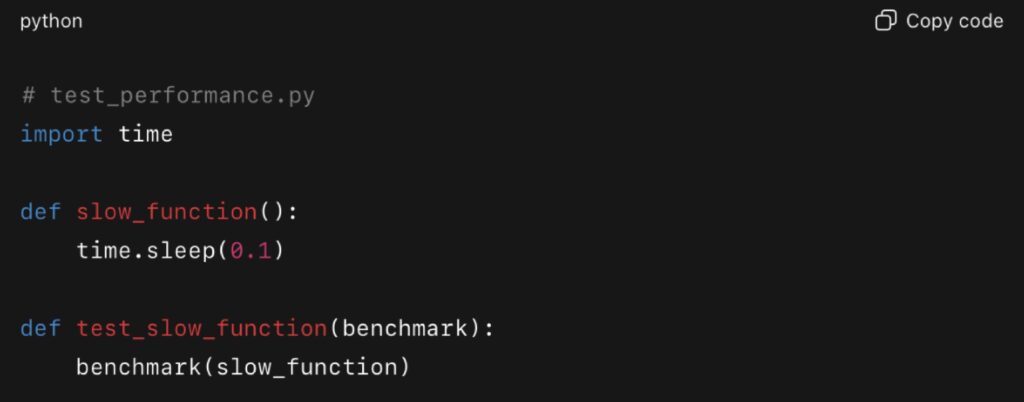
This integrates with pytest to benchmark functions across test runs. If execution time drifts beyond a threshold, the pipeline can fail, preventing regressions from being merged.
A 2023 JetBrains article recommended this approach for Python teams building data-heavy services, noting that automated benchmarks often catch performance regressions before they appear in production.
Profiling as Part of Development Workflow
Profiling should not just happen during emergencies. Integrating tools like Py-Spy, cProfile, or Scalene into development workflows helps maintain visibility. Scalene in particular has gained traction since 2023 because it measures CPU, GPU, and memory usage line-by-line, making it easier to connect optimizations to real bottlenecks.
Example with Scalene:
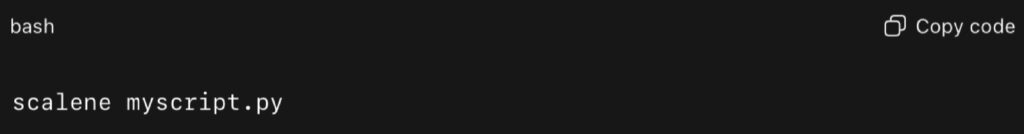
The output shows per-line execution costs, allowing teams to validate that Python performance improvements remain effective across updates.
Continuous Monitoring in Production
Even with strong CI/CD pipelines, some bottlenecks only appear in production under real workloads. Continuous Application Performance Monitoring (APM) ensures teams detect and respond quickly.
Services like Datadog, New Relic, and Grafana Pyroscope integrate directly with Python applications. They provide flame graphs, latency distributions, and error traces. For example, Datadog’s 2024 documentation shows how its Python profiler captures async call stacks in FastAPI, helping teams pinpoint slow I/O-bound endpoints.
By combining these tools with alerts, teams ensure that if Python performance degrades, they know within minutes—not after users complain.
Real-World Examples
- Datadog (2024): Showed how production Python profiling revealed async endpoint delays caused by poorly tuned database connections, leading to a 30% latency reduction after fixes.
- JetBrains (2023): Advocated integrating pytest-benchmark into CI/CD to stop regressions before release.
- Grafana Pyroscope (2024): Open-source continuous profiling system that teams adopted to track Python bottlenecks across microservices with low overhead.
Tradeoffs and Considerations
Continuous testing and monitoring do come with overhead. Python performance tests can lengthen pipelines, and monitoring tools add some runtime cost. But the tradeoff is worthwhile: the cost of catching regressions early is far lower than the cost of debugging outages in production.
Final Takeaway
Improving Python performance is not a one-time task. It requires vigilance through testing and monitoring. By integrating benchmarking into CI/CD pipelines, using profilers regularly, and adopting continuous monitoring tools in production, teams ensure that their hard-won optimizations endure. In 2025, sustainable performance is not just about writing faster code—it’s about building systems that stay fast over time.
The Road Ahead for Python Performance Optimization
Improving Python performance is not about chasing speed for its own sake. It’s about building systems that are fast, efficient, and sustainable in real-world conditions. In 2025, developers have a wealth of tools and practices to achieve this balance—from profiling to caching, concurrency to parallelism, and lightweight JIT compilers to full-fledged DataFrame engines. The challenge is knowing when to use each strategy, and how to combine them responsibly.
Key Takeaways
- Measure first: Profiling tools like Py-Spy and Scalene ensure you solve real problems instead of guessing.
- Choose the right structures: Picking sets, deques, or defaultdicts over lists and dicts can quietly eliminate bottlenecks.
- Write smarter loops: Comprehensions, generators, and vectorization consistently improve Python performance in everyday workloads.
- Apply concurrency and parallelism wisely: Async for I/O, multiprocessing for CPU-bound tasks, and sometimes both together.
- Cache intelligently: From lru_cache to Redis to joblib, caching is often the fastest route to immediate speed gains.
- Use external accelerators: Numba, Cython, Polars, and PyPy extend Python’s capabilities far beyond its interpreter limits.
- Balance tradeoffs: Readability, maintainability, and cloud cost are as important as runtime speed.
- Monitor continuously: Integrating benchmarks and APM ensures that Python performance gains endure in production.
Beyond Optimization
True optimization is not just about writing faster code—it’s about delivering value. Sometimes the best solution is leaving code as it is, focusing on clarity until profiling proves otherwise. Sometimes the answer is adopting a new library or interpreter. And sometimes, performance tuning is about infrastructure, not algorithms.
In practice, improving Python performance is about making informed choices. Every system is unique, and the best optimizations are the ones that align with your goals, your team’s skills, and your users’ needs. That’s why partnering with Fyld can make a difference on how effective your efforts are.
Suggested Next Steps
- Start with profiling on your own codebase using Scalene or Py-Spy.
- Run experiments with Polars, Numba, or joblib in real workloads.
- Set up a simple performance test in CI/CD to catch regressions.
- Review cloud costs to make sure your optimizations align with budget.
- Keep learning: A good resource is “Practical Performance Tips in Python” from Real Python (realpython.com/tutorials/performance, updated in 2023).
Final Thought
Python will never be the fastest language on raw benchmarks, but with the right strategies, it can be fast enough — and far more maintainable and versatile than many alternatives. The best engineers in 2025 are not just those who squeeze out every microsecond, but those who know how to improve Python performance in ways that scale with teams, systems, and users.